Speed

Speed is the distance travelled per unit time.

$$s={{d}\over{t}}$$

‘S’ = speed (m/s or km/hr)

‘d’ = Distance (m or km)

‘t’ = time (s or hr)

Distance Time Graph
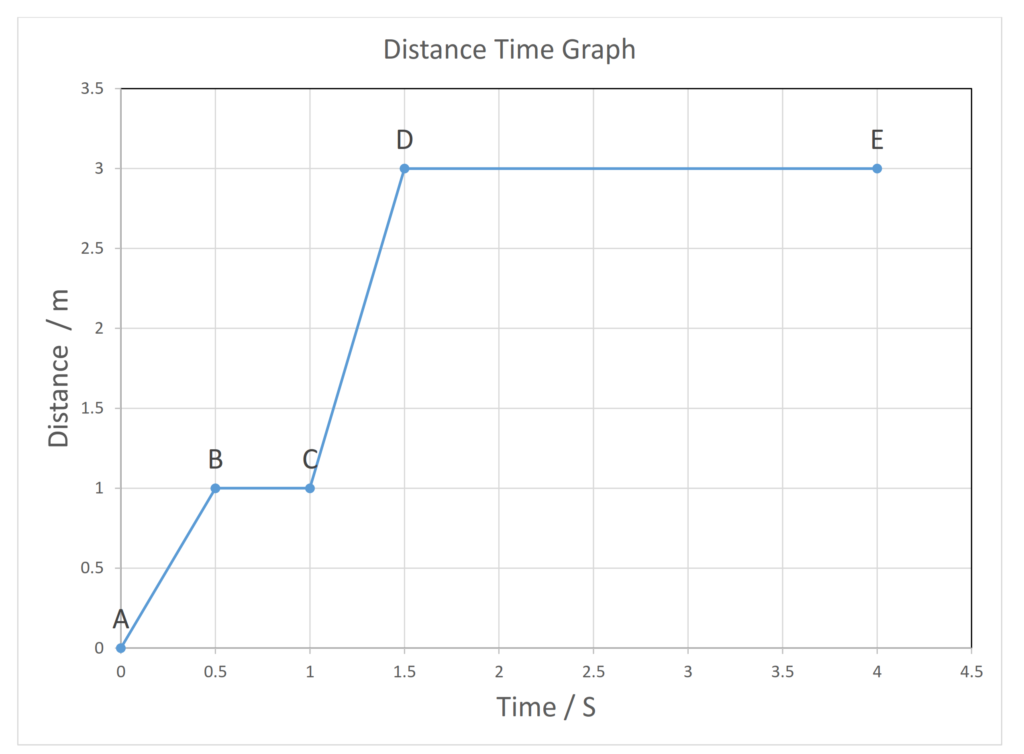
  • A – B  Distance traveled = 1m, and Time taken = 0.5 S
  • B – C  Distance traveled = 0m, and Time taken = 0.5 S
  • C – D  Distance traveled = 2m, and Time taken = 0.5 S
  • D – E  Distance traveled = 0m, and Time taken = 2.5 S
  • Total Distance traveled = 3m

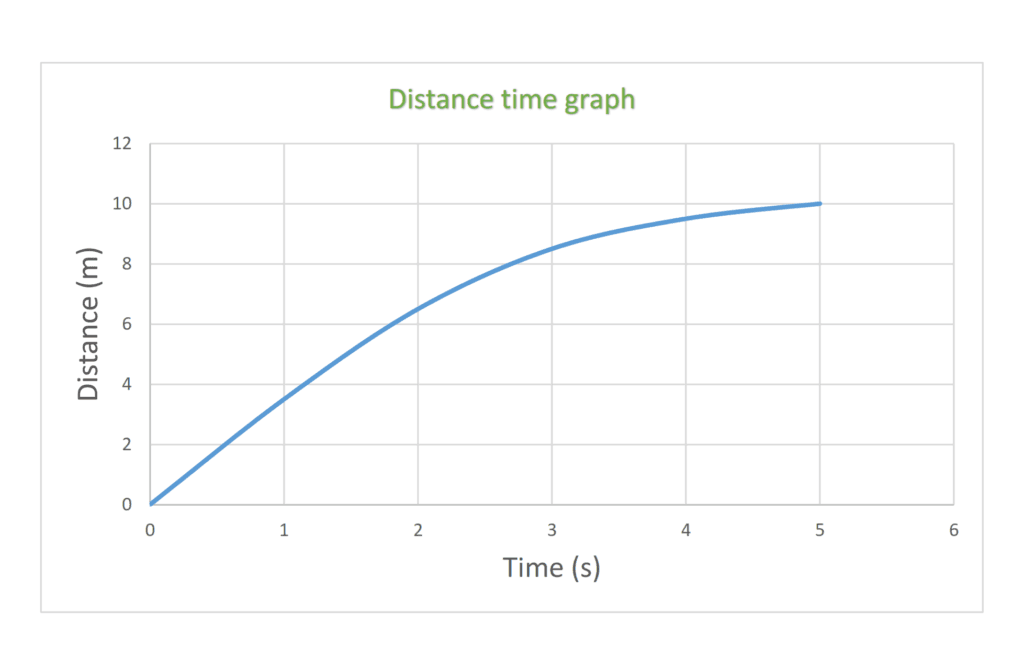
Distance time graphs. If an object moves along a straight line, the distance travelled can be represented by a distance-time graph.

On a distance time graph, the gradient of the line is equal to the speed of the object.
  • Determine, qualitatively, from given data or the shape of a distance–time graph when an object is:
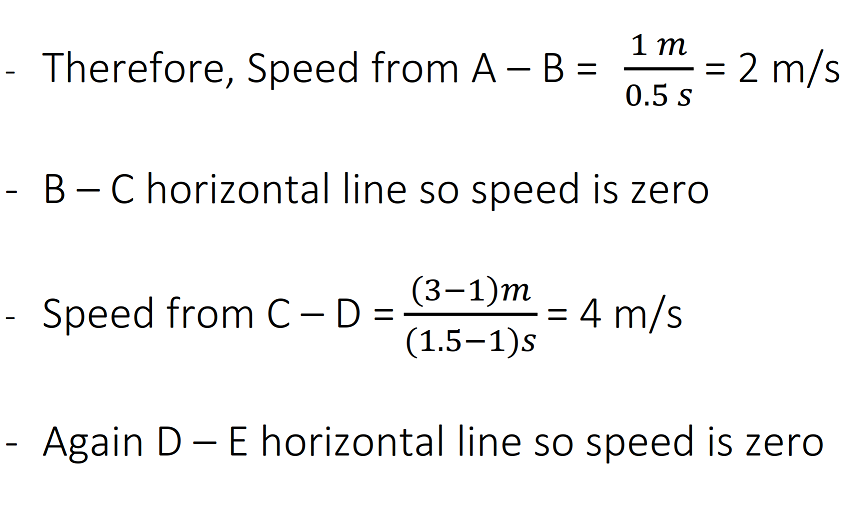
    (a) at rest
    (b) moving with constant speed
    (c) accelerating
    (d) decelerating

(a) at rest
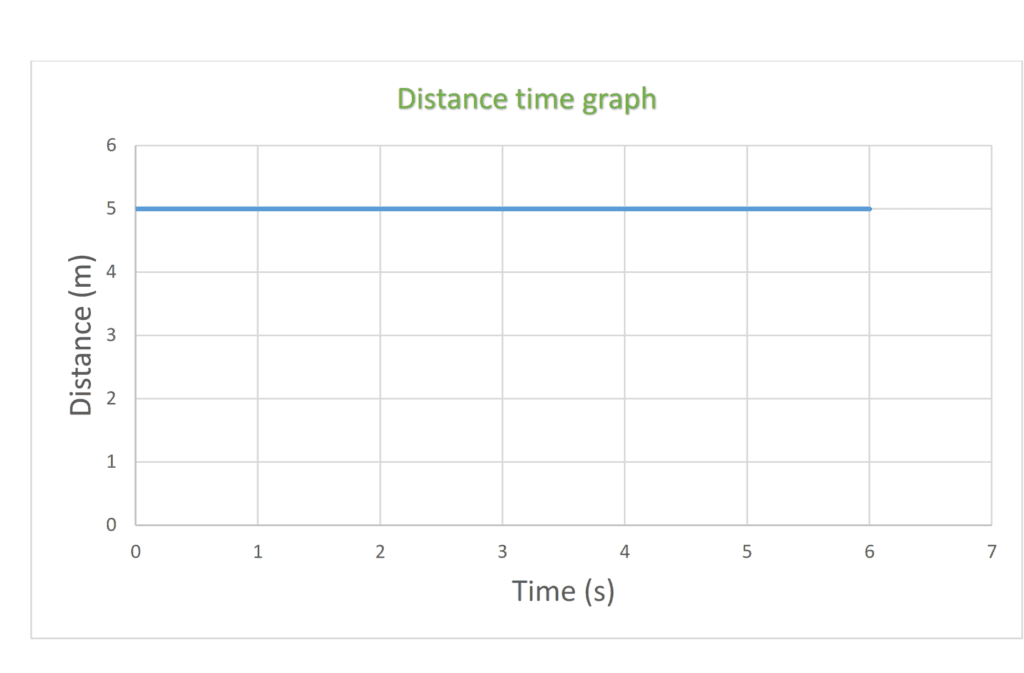
(b) moving with constant speed
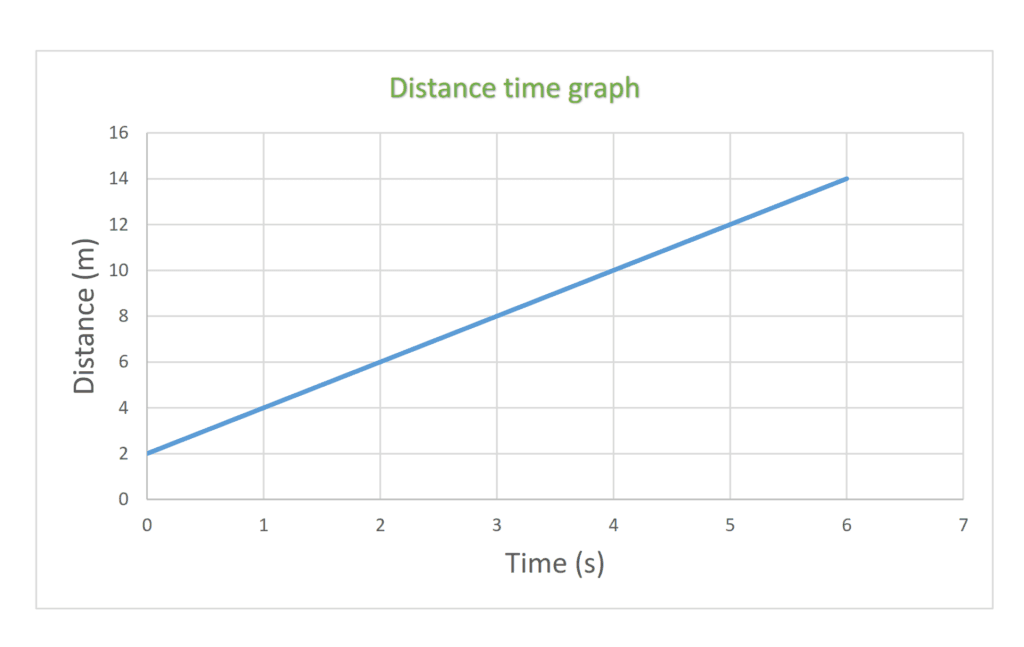
(c) accelerating
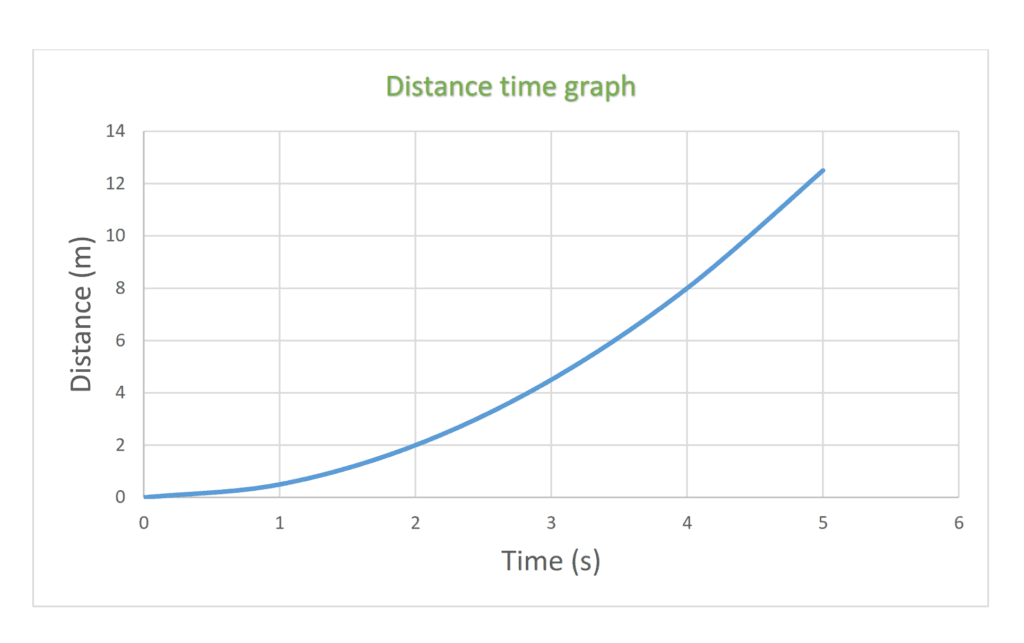
(d) decelerating
Speed Time Graph

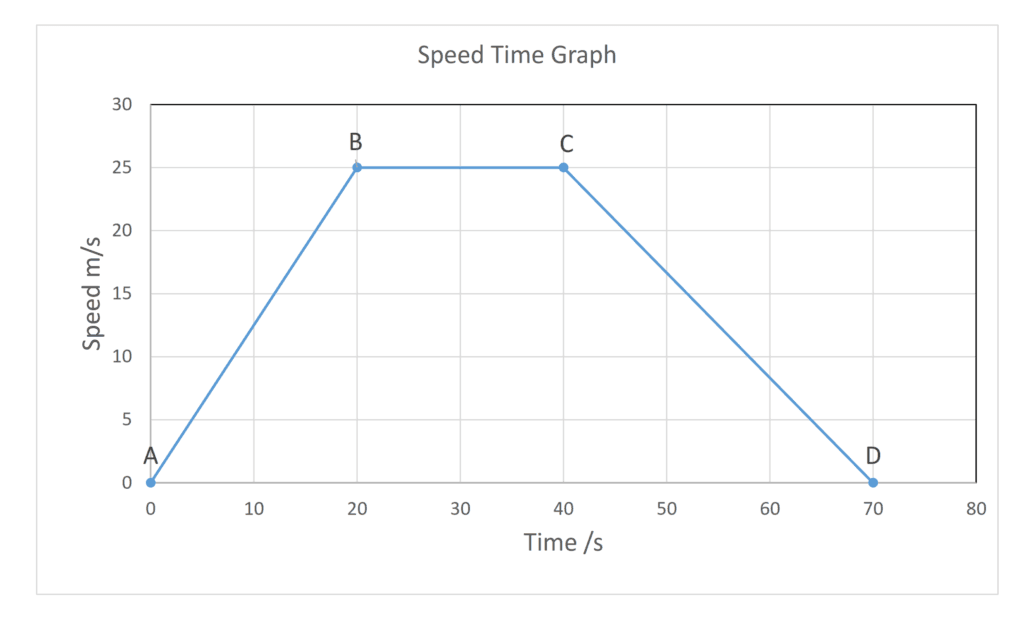
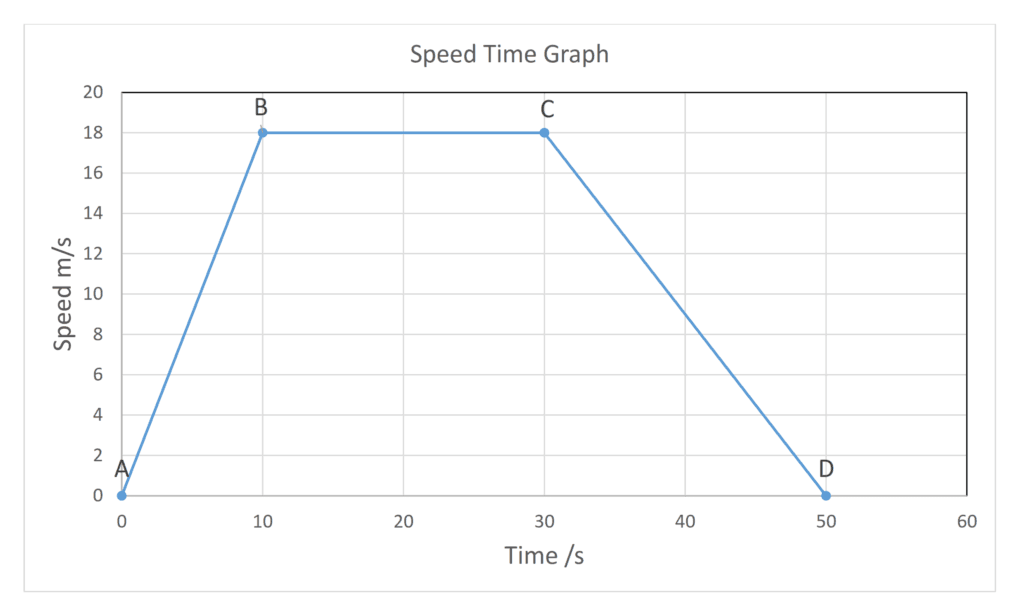
A lorry is moving in traffic and its motion is shown below
Speed Time Graph
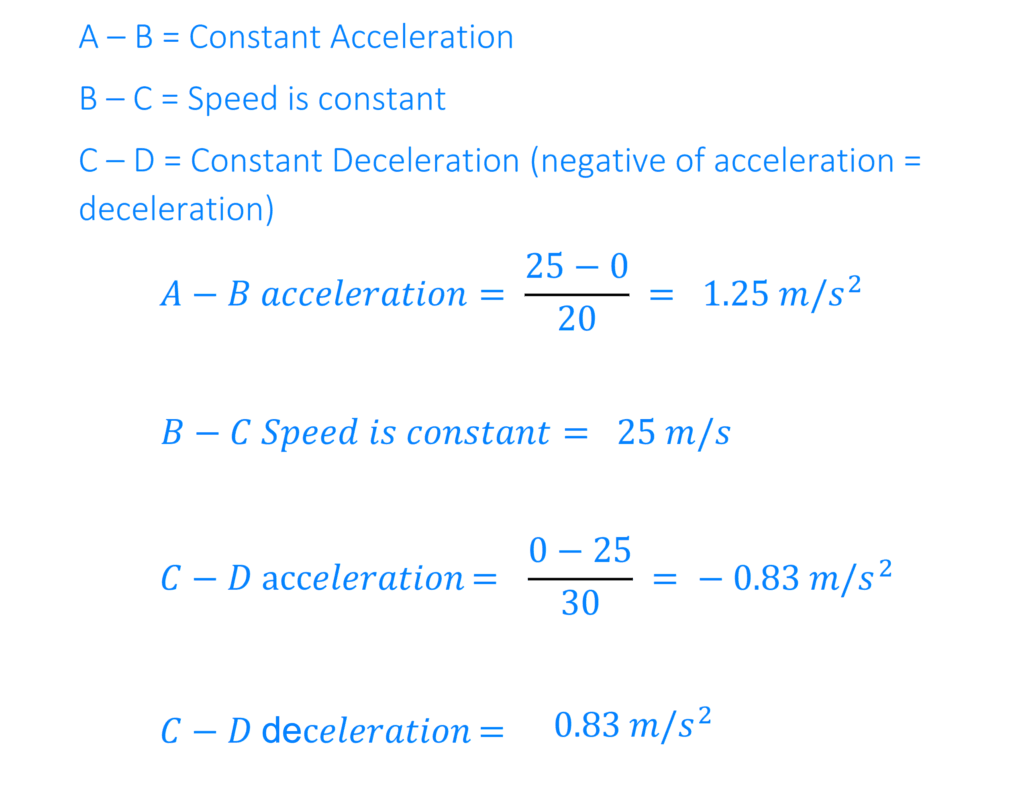
  • A – B = Acceleration
  • B – C = Steady Speed / Constant Speed / Uniform Speed
  • C – D = Deceleration
  • Speed Time Graphs show the speed of an object over time.
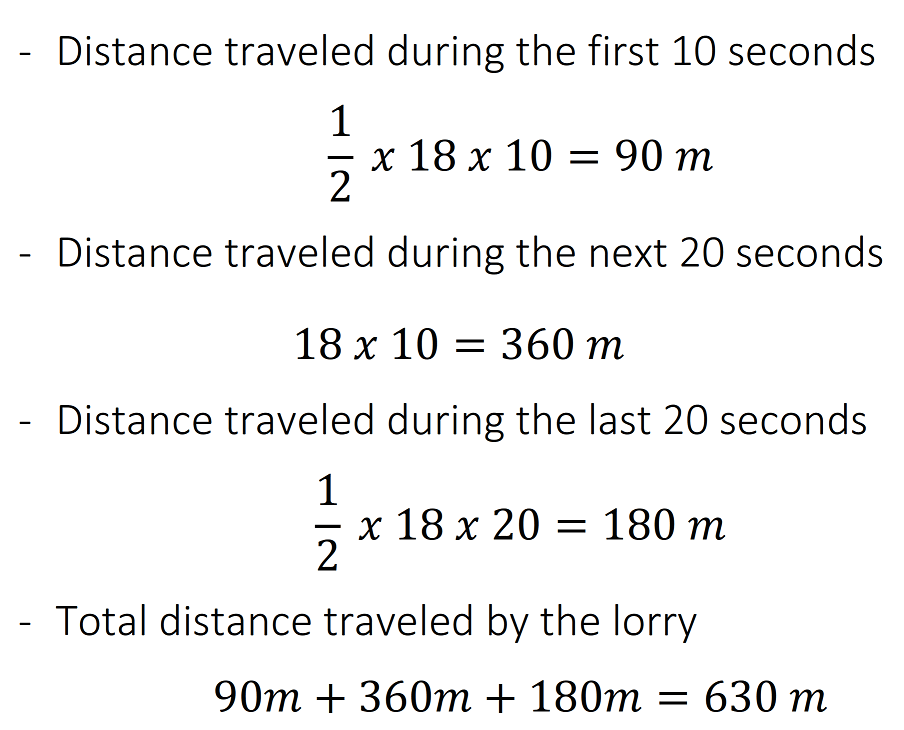
  • The Area under the speed time graph is the distance traveled

Therefore, total distance traveled by the lorry is:
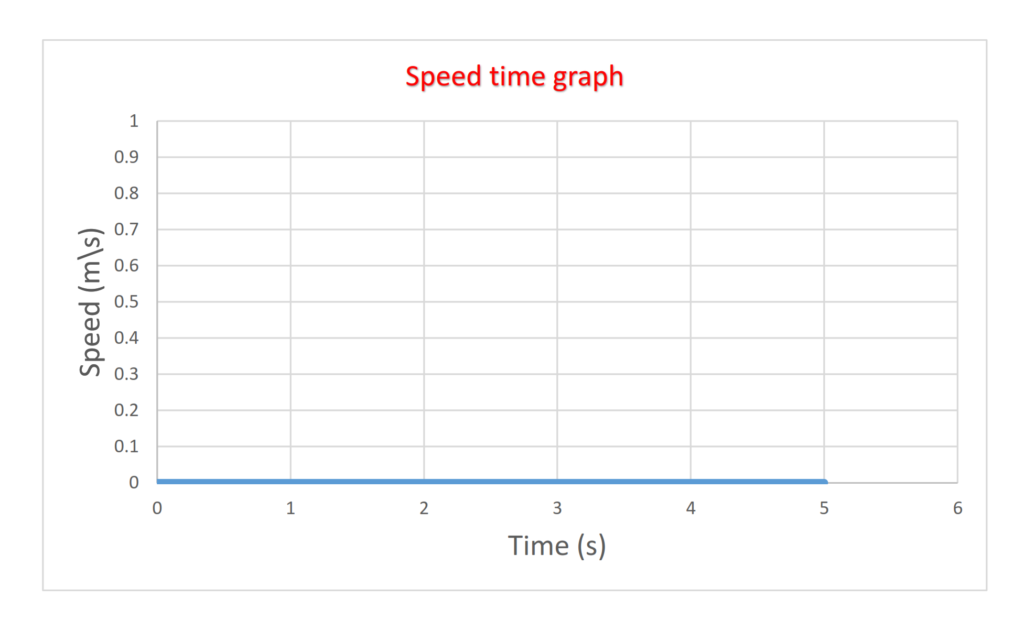
  • When a speed time graph is at rest the line meets the x – axis.
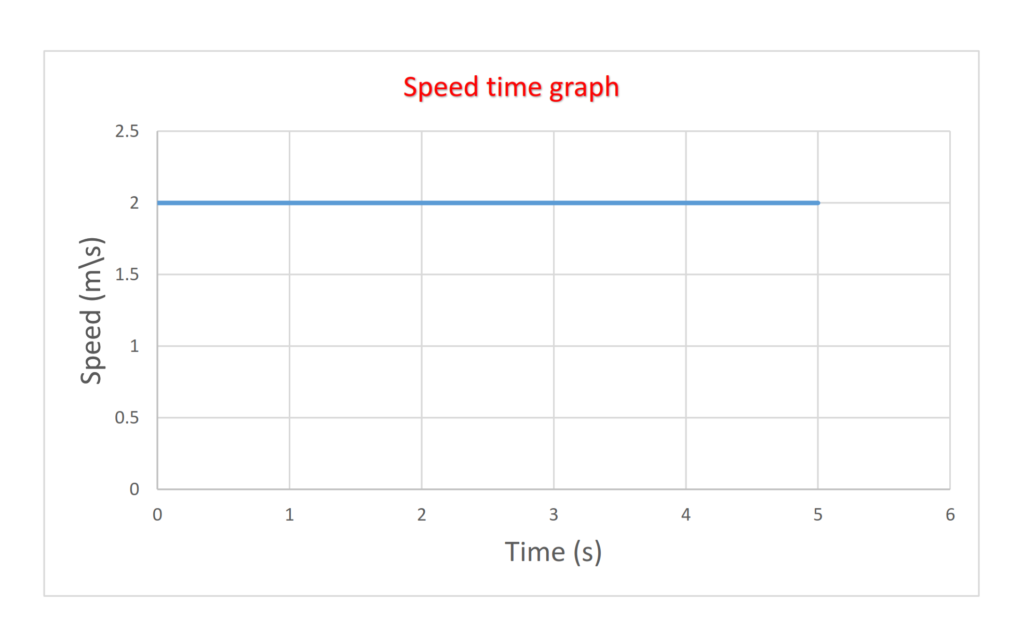
  • When an object moves with a constant speed we draw the line parallel to the x – axis.
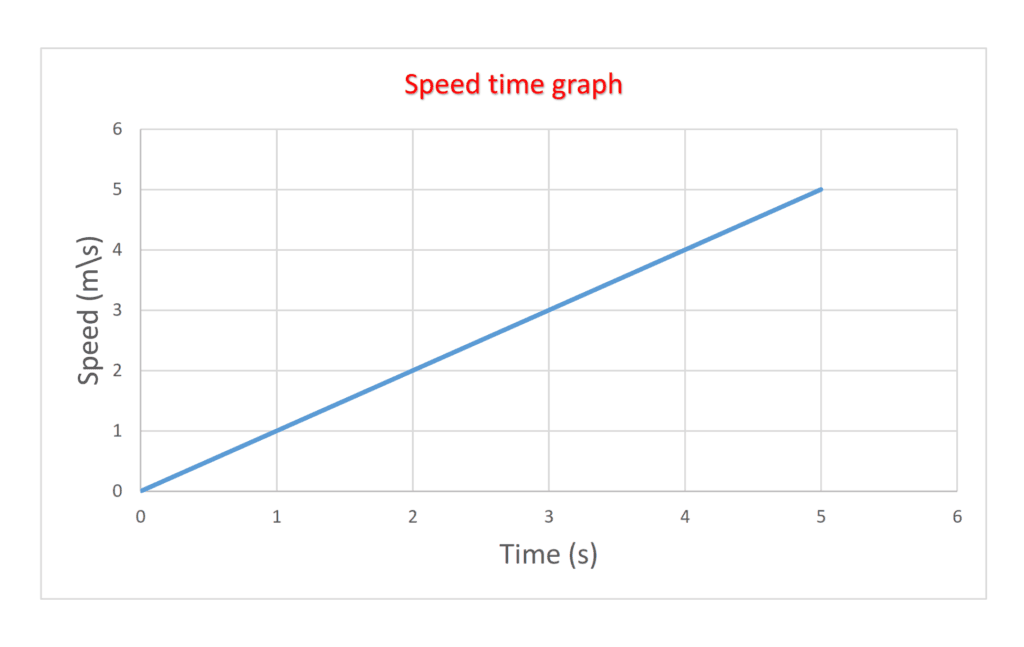
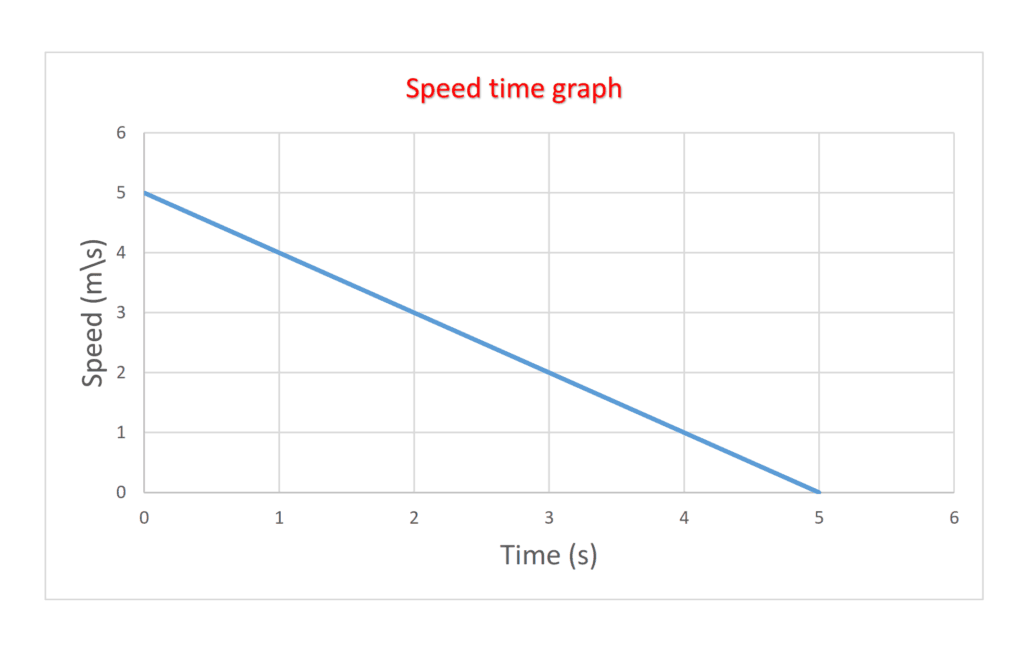
  • When the object moves with a changing speed the line slopes.
  • Determine, qualitatively, from given data or the shape of a speed–time graph when an object is:
    (a) at rest
    (b) moving with constant speed
    (c) accelerating
    (d) decelerating

(a) at rest
(b) moving with constant speed
(c) accelerating
(d) decelerating
Velocity  

Velocity is a vector quantity & Speed is a scalar quantity

Velocity is the rate of change in displacement. (or. Speed in a specific Direction)

$$v={{d}\over{t}}$$

‘v’ = velocity (m/s or km/hr)

‘d’ = Displacement (m or km)

‘t’ = time (s or hr)

Acceleration

Acceleration is the rate of change in velocity.

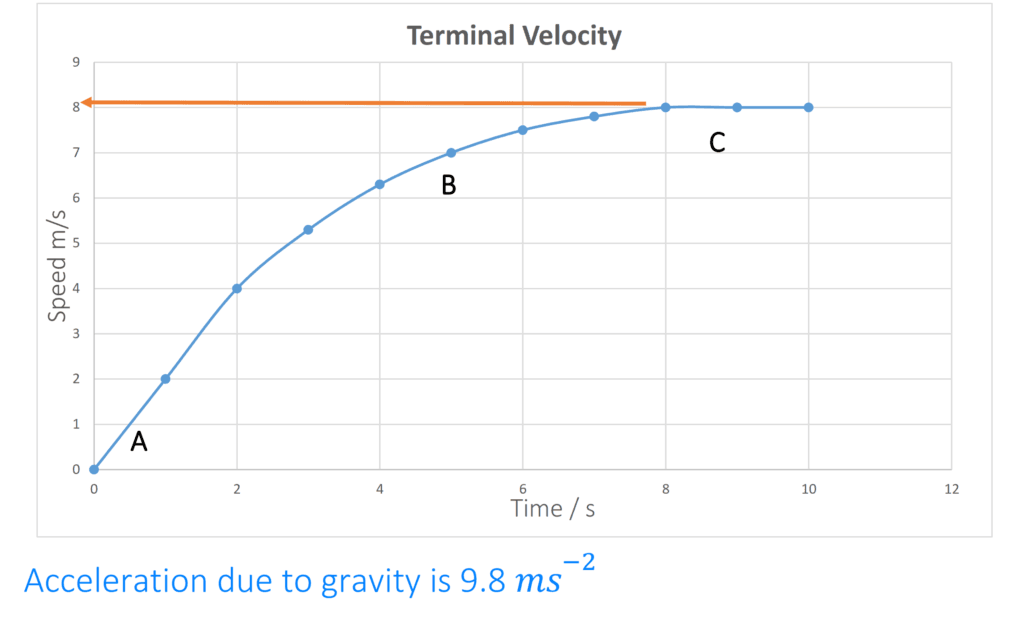
Acceleration of free fall for a body near to the Earth is constant.

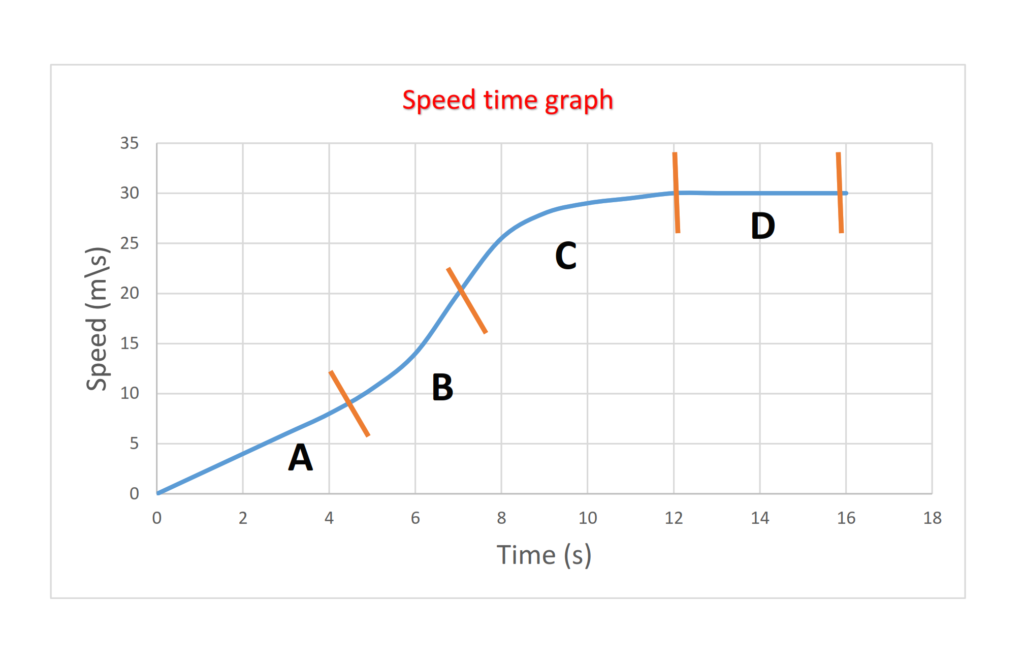
Speed Time graph
  • Determine from given data or the shape of a speed–time graph when an object is moving with:
    (a) Constant acceleration
    (b) Changing acceleration
Terminal Velocity

/20

1.2 Motion

Physics quiz helps us to increase our knowledge

1 / 20

A steel ball is dropped from the top floor of a building. Air resistance can be ignored.
Which statement describes the motion of the ball?

2 / 20

The speed–time graph represents a journey.

How does the graph show that the distance travelled in section X of the journey is greater than the distance travelled in section Y?

How does the graph show that the distance travelled in section X of the journey is greater than the distance travelled in section Y?

3 / 20

Two stones of different weights fall at the same time from a table. Air resistance may be ignored.
What will happen and why?

Two stones of different weights fall at the same time from a table. Air resistance may be ignored. What will happen and why?

4 / 20

Two rockets are launched at the same time from the surface of the Earth. The graph shows how the speeds of the rockets change with time.

Which statement about the rockets is correct?

Two rockets are launched at the same time from the surface of the Earth. The graph shows how the speeds of the rockets change with time.

5 / 20

A cyclist records his speed and the distance travelled during a journey.
He then plots the data against time for different sections of his journey.
Which graph shows a section when he is moving with constant speed?

A cyclist records his speed and the distance travelled during a journey. He then plots the data against time for different sections of his journey. Which graph shows a section when he is moving with constant speed?

6 / 20

The speed–time graph shows the motion of an object.

How far does the object travel at constant speed?

The speed–time graph shows the motion of an object.

7 / 20

A cyclist rides 300 m up a slope in 50 s.
She then rides down the slope in 25 s.
What is her average speed for the whole journey?

8 / 20

A tennis ball falls from the upstairs window of a house.

What can be said about the acceleration of the ball if air resistance is ignored?

A tennis ball falls from the upstairs window of a house. What can be said about the acceleration of the ball if air resistance is ignored?

9 / 20

The motion of an object is represented by the speed–time graph shown.

Which quantity is equal to the area under the graph?

10 / 20

An athlete runs 300 m up a hill in 100 s.
She then runs down the same hill in 50 s.
What is her average speed for the whole run?

11 / 20

The distance–time graph for a motorway journey is shown.

What is the average speed for the journey?

The distance–time graph for a motorway journey is shown. What is the average speed for the journey?

12 / 20

The graph shows how the speed of a car changes with time over part of a journey.

Which section of the graph shows acceleration and which section of the graph shows deceleration?

13 / 20

A car driver measures the time taken to complete four separate journeys.
In which journey does the driver have the greatest average speed?

A car driver measures the time taken to complete four separate journeys. In which journey does the driver have the greatest average speed?

14 / 20

The diagram shows the distance–time graph for the motion of an object.

How can the motion of the object be described?

The diagram shows the distance–time graph for the motion of an object.

15 / 20

The graph shows how the speed of an object varies with time.

The graph shows how the speed of an object varies with time.

16 / 20

A boy throws a ball vertically upwards with a speed v

Which row describes the speed and the acceleration of the ball at point X on the way upwards?

Which row describes the speed and the acceleration of the ball at point X on the way upwards?

17 / 20

The graph shows how the speed of an object varies with time.
At which labelled time is the acceleration greatest?

The graph shows how the speed of an object varies with time. At which labelled time is the acceleration greatest?

18 / 20

A train begins a journey from a station and travels 60 km in a time of 20 minutes.
What is the average speed of the train?

19 / 20

Which statement about acceleration is correct?

20 / 20

The diagram shows a speed–time graph for a moving object.

Which statement describes the motion of the object?

Which statement describes the motion of the object?

Your score is

0%

Leave a Reply

Your email address will not be published. Required fields are marked *

error: Content is protected !!